[ AWS Monitoring : CloudWatch Alarms ]
Alarm은 metric 값에 대한 알림을 주기위해 사용
- Alarms are used to trigger notifications for any metric
- Various options (sampling, %, max, min, etc..)
- Alarms States :
1) OK
2) INSUFFICIENT_DATA
3) ALARM
- Period :
-- Length of time in seconds to evaludate the metric
-- High resolution custom metrics : 10 sec, 30 sec, or multiples of 60 sec
[ CloudWatch Alarm Targets ]
CloudWatch 가 Alarm 이 울리면(metric 값에 의해) EC2 를 Stop, Terminate, Reboot, or Recover 할 수 있음
Auto Scaling 실행
SNS 로 알림
- Stop, Terminate, Reboot, or Recover an EC2 Instance
- Trigger Auto Scaling Action
- Send notification to SNS (from which you can do pretty much anything)
[ EC2 Instance Recovery ]
- Status Check :
Instance status = check the EC2 VM
System status = check the underlying hardware

Recovery : Same Private, Public, Elastic IP, metadata, placement group
[ CloudWatch Alarm : good to know ]
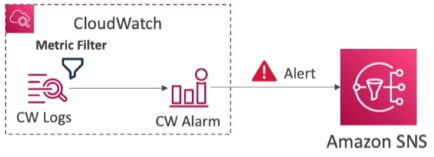
CloudWatch Logs Metrics Filter 에 의해 알람이 생성되며 알람은 SNS 를 통해 adm에게 알림
- Alarms can be created based on CloudWatch Logs Metrics Filters
- To test alarms and notifications, set the alarm state to Alarm using CLI
aws cloudwatch set-alarm-state --alarm-name "myalarm" --state-value ALARM --state-reason "testing purposes"
[ CloudWatch Events ]
AWS 서비스 관제기능
EC2 인스턴스 기동 등의 AWS 서비스로부터 이벤트 인터셉트. 스케쥴링이나 크론으로 설정 가능
* EC2 인스턴스 실행시 관제 메시지 발생시키거나 하는 등의 기능
Event Pattern : Intercept events from AWS services (Sources)
- Example sources: EC2 Instance Start, CodeBuild Failure, S3, Trusted Advisor
- Can intercept any API call with CloudTrail integration
Schedule or Cron
A JSON payload is created from the event and passed to a target
- Compute : Lambda, Batch, ECS task
- Integration : SQS, SNS, Kinesis Data Streams, Kinesis Data Firehose
- Orchestration : Step Functions, CodePipeline, CloudBuild
- Maintenance : SSM, EC2 Actions
'infra & cloud > AWS' 카테고리의 다른 글
| [AWS] 19-5. CloudTrail (0) | 2022.05.16 |
|---|---|
| [AWS] 19-4. AWS EventBridge (0) | 2022.05.16 |
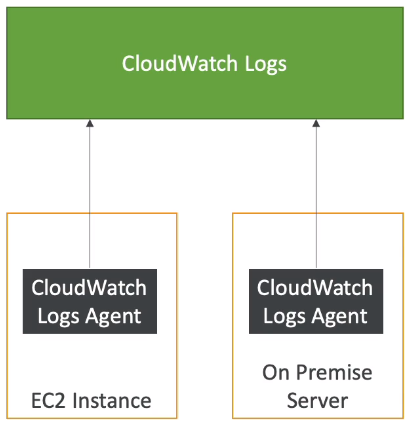
| [AWS] 19-2. AWS Monitoring : CloudWatch Logs, Agent (0) | 2021.09.28 |
| [AWS] 19. AWS Monitoring : CloudWatch (0) | 2021.09.27 |
| [AWS] 18-10. Databases in AWS : ElasticSearch (0) | 2021.09.26 |