[ AWS Monitoring : CloudWatch Logs ]
- Applications can send logs to CloudWatch using the SDK
- CloudWatch can collect log from :
1) Elastic Beanstalk : collection of logs from application
2) ECS : collection from containers
3) AWS Lambda : collection from function logs
4) VPC Flow Logs : VPC specific logs
5) API Gateway
6) CloudTrail based on filter
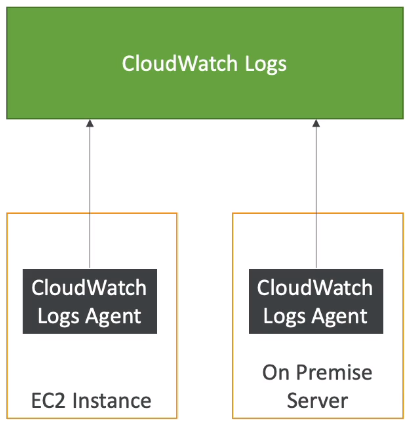
7) CloudWatch log agents : for example on EC2 machines
8) Route53 : Log DNS queries
- CloudWatch Logs can go to :
1) Batch exporter to S3 for archival
2) Stream to ElasticSearch cluster for further analytics
[ AWS CloudWatch Logs ]
- Logs storage architecture :
-- Log groups : arbitrary(임의의) name, usually representing an application
-- Log stream : instances within application/log files/containers
- Can define log expiration policies (never expire, 30 days, etc..)
- Using the AWS CLI we can trail CloudWatch logs
- To send logs to CloudWatch, make sure IAM permissions are correct!
- Security : encryption of logs using KMS at the Group Level
[ CloudWatch Logs Metric Filter & Insights ]
- CloudWatch Logs can use filter expressions
-- For example, find a specific IP inside of a log
-- Metric filters can be used to trigger alarms
※ CloudWatch Logs Insights (new - Nov 2018) can be used to query logs and add queries to CloudWatch Dashboards
[ CloudWatch Logs for EC2 ]
- By default, no logs from your EC2 machine will go to CloudWatch
- You need to run a CloudWatch agent on EC2 to push the log files you want
- Make sure IAM permissions are correct
- The CloudWatch log agent can be setup on-premises too

※ On-premise : 자사가 보유한 서버에 서비스 구축
※ Off-premise : AWS와 같은 원격 클라우드 등에 서비스 구축
[ CloudWatch Log Agent & Unified Agent ]
- For virtual servers (EC2 instances, on-premise servers..)
1. CloudWatch Logs Agent
- Old version of the agent
- Can only send to CloudWatch Logs
-2. CloudWatch Unified Agent
- Collect additional system-level metrics such as RAM, processes, etc...
- Collect logs to send to CloudWatch Logs
- Centralized configuration using SSM Parameter Store
[ CloudWatch Unified Agent - Metrics ]
- Collected directly on your Linux server / EC2 instance
1) CPU (active, guest, idle, system, user, steal)
2) Disk metrics (free, used, total), Disk IO (writes, reads, bytes, iops)
3) RAM (free, inactive, used, total, cached)
4) Netstat (number of TCP and UDP connections, net packets, bytes)
5) Processes (total, dead, bloqued, idle, running, sleep)
6) Swap Sapce (free, used, used &)
※ Reminder : out-of-the box metrics for EC2 - disk, CPU, network (high level)
'infra & cloud > AWS' 카테고리의 다른 글
| [AWS] 19-4. AWS EventBridge (0) | 2022.05.16 |
|---|---|
| [AWS] 19-3. AWS Monitoring : CloudWatch Alarms (0) | 2021.09.28 |
| [AWS] 19. AWS Monitoring : CloudWatch (0) | 2021.09.27 |
| [AWS] 18-10. Databases in AWS : ElasticSearch (0) | 2021.09.26 |
| [AWS] 18-9. Databases in AWS : Neptune (0) | 2021.09.26 |