1. sync vs async
2. block vs non-block
메소드를 호출하는 클라이언트 관점.
메소드 호출시 응답을 받을때 까지 기다린다 block
메소드 호출 후 다른 작업 수행이 가능, 메소드 내에서 callback 함수를 호출해주어 클라이언트에 결과 회신
https://brunch.co.kr/@springboot/267#comment
https://brunch.co.kr/@springboot/267#comment
반응형
1. sync vs async
2. block vs non-block
메소드를 호출하는 클라이언트 관점.
메소드 호출시 응답을 받을때 까지 기다린다 block
메소드 호출 후 다른 작업 수행이 가능, 메소드 내에서 callback 함수를 호출해주어 클라이언트에 결과 회신
https://brunch.co.kr/@springboot/267#comment
https://brunch.co.kr/@springboot/267#comment
C:\Users\사용자\AppData\Roaming\Subversion\auth\svn.simple 제거
| [SVN] 계정/그룹 생성 및 권한 관리 : authz 설정 (0) | 2021.03.15 |
|---|---|
| [SVN] eclipse 에 자동로그인된 svn 계정 정보 제거 (0) | 2021.03.11 |
| [SVN] branch 와 trunk merge (2) | 2021.02.10 |
| [SVN] Override and Commit 이 사라진 경우 (Subclipse) (0) | 2019.10.31 |
[ AWS Monitoring : CloudWatch Alarms ]
Alarm은 metric 값에 대한 알림을 주기위해 사용
- Alarms are used to trigger notifications for any metric
- Various options (sampling, %, max, min, etc..)
- Alarms States :
1) OK
2) INSUFFICIENT_DATA
3) ALARM
- Period :
-- Length of time in seconds to evaludate the metric
-- High resolution custom metrics : 10 sec, 30 sec, or multiples of 60 sec
[ CloudWatch Alarm Targets ]
CloudWatch 가 Alarm 이 울리면(metric 값에 의해) EC2 를 Stop, Terminate, Reboot, or Recover 할 수 있음
Auto Scaling 실행
SNS 로 알림
- Stop, Terminate, Reboot, or Recover an EC2 Instance
- Trigger Auto Scaling Action
- Send notification to SNS (from which you can do pretty much anything)
[ EC2 Instance Recovery ]
- Status Check :
Instance status = check the EC2 VM
System status = check the underlying hardware

Recovery : Same Private, Public, Elastic IP, metadata, placement group
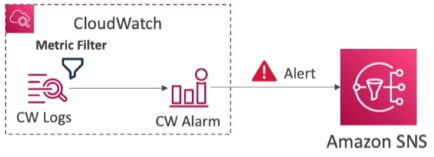
[ CloudWatch Alarm : good to know ]
CloudWatch Logs Metrics Filter 에 의해 알람이 생성되며 알람은 SNS 를 통해 adm에게 알림
- Alarms can be created based on CloudWatch Logs Metrics Filters
- To test alarms and notifications, set the alarm state to Alarm using CLI
aws cloudwatch set-alarm-state --alarm-name "myalarm" --state-value ALARM --state-reason "testing purposes"
[ CloudWatch Events ]
AWS 서비스 관제기능
EC2 인스턴스 기동 등의 AWS 서비스로부터 이벤트 인터셉트. 스케쥴링이나 크론으로 설정 가능
* EC2 인스턴스 실행시 관제 메시지 발생시키거나 하는 등의 기능
Event Pattern : Intercept events from AWS services (Sources)
- Example sources: EC2 Instance Start, CodeBuild Failure, S3, Trusted Advisor
- Can intercept any API call with CloudTrail integration
Schedule or Cron
A JSON payload is created from the event and passed to a target
- Compute : Lambda, Batch, ECS task
- Integration : SQS, SNS, Kinesis Data Streams, Kinesis Data Firehose
- Orchestration : Step Functions, CodePipeline, CloudBuild
- Maintenance : SSM, EC2 Actions
| [AWS] 19-5. CloudTrail (0) | 2022.05.16 |
|---|---|
| [AWS] 19-4. AWS EventBridge (0) | 2022.05.16 |
| [AWS] 19-2. AWS Monitoring : CloudWatch Logs, Agent (0) | 2021.09.28 |
| [AWS] 19. AWS Monitoring : CloudWatch (0) | 2021.09.27 |
| [AWS] 18-10. Databases in AWS : ElasticSearch (0) | 2021.09.26 |
[ AWS Monitoring : CloudWatch Logs ]
- Applications can send logs to CloudWatch using the SDK
- CloudWatch can collect log from :
1) Elastic Beanstalk : collection of logs from application
2) ECS : collection from containers
3) AWS Lambda : collection from function logs
4) VPC Flow Logs : VPC specific logs
5) API Gateway
6) CloudTrail based on filter
7) CloudWatch log agents : for example on EC2 machines
8) Route53 : Log DNS queries
- CloudWatch Logs can go to :
1) Batch exporter to S3 for archival
2) Stream to ElasticSearch cluster for further analytics
[ AWS CloudWatch Logs ]
- Logs storage architecture :
-- Log groups : arbitrary(임의의) name, usually representing an application
-- Log stream : instances within application/log files/containers
- Can define log expiration policies (never expire, 30 days, etc..)
- Using the AWS CLI we can trail CloudWatch logs
- To send logs to CloudWatch, make sure IAM permissions are correct!
- Security : encryption of logs using KMS at the Group Level
[ CloudWatch Logs Metric Filter & Insights ]
- CloudWatch Logs can use filter expressions
-- For example, find a specific IP inside of a log
-- Metric filters can be used to trigger alarms
※ CloudWatch Logs Insights (new - Nov 2018) can be used to query logs and add queries to CloudWatch Dashboards
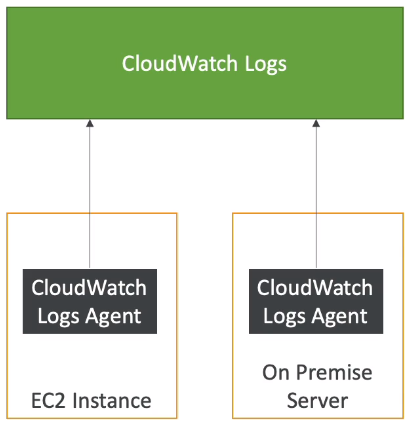
[ CloudWatch Logs for EC2 ]
- By default, no logs from your EC2 machine will go to CloudWatch
- You need to run a CloudWatch agent on EC2 to push the log files you want
- Make sure IAM permissions are correct
- The CloudWatch log agent can be setup on-premises too
※ On-premise : 자사가 보유한 서버에 서비스 구축
※ Off-premise : AWS와 같은 원격 클라우드 등에 서비스 구축
[ CloudWatch Log Agent & Unified Agent ]
- For virtual servers (EC2 instances, on-premise servers..)
1. CloudWatch Logs Agent
- Old version of the agent
- Can only send to CloudWatch Logs
-2. CloudWatch Unified Agent
- Collect additional system-level metrics such as RAM, processes, etc...
- Collect logs to send to CloudWatch Logs
- Centralized configuration using SSM Parameter Store
[ CloudWatch Unified Agent - Metrics ]
- Collected directly on your Linux server / EC2 instance
1) CPU (active, guest, idle, system, user, steal)
2) Disk metrics (free, used, total), Disk IO (writes, reads, bytes, iops)
3) RAM (free, inactive, used, total, cached)
4) Netstat (number of TCP and UDP connections, net packets, bytes)
5) Processes (total, dead, bloqued, idle, running, sleep)
6) Swap Sapce (free, used, used &)
※ Reminder : out-of-the box metrics for EC2 - disk, CPU, network (high level)
| [AWS] 19-4. AWS EventBridge (0) | 2022.05.16 |
|---|---|
| [AWS] 19-3. AWS Monitoring : CloudWatch Alarms (0) | 2021.09.28 |
| [AWS] 19. AWS Monitoring : CloudWatch (0) | 2021.09.27 |
| [AWS] 18-10. Databases in AWS : ElasticSearch (0) | 2021.09.26 |
| [AWS] 18-9. Databases in AWS : Neptune (0) | 2021.09.26 |
[ AWS Monitoring : CloudWatch ]
[ CloudWatch Metrics ]
- CloudWatch provides metrics for every services in AWS
- Metric is a variable to monitor (CPUUtilization, NetworkIn..)
- Metrics belong to namespaces
- Demension is an attribute of a metric (instance id, environment, etc...)
- Up to 10 dimensions per metric
- Metrics have timestamps
- Can create CloudWatch dashboards of metrics
[ EC2 Detailed monitoring ]
- EC2 instance metrics have metrics "every 5 minutes"
- With detailed monitoring (for a cost), you get data "every 1 minute"
- Use detailed monitoring if you want to scale faster for your ASG
- The AWS Free Tier allows us to have 10 detailed monitoring metrics
※ Note : EC2 Memory usage is by default no pushed (must be pushed from inside the instance as a custom metric)
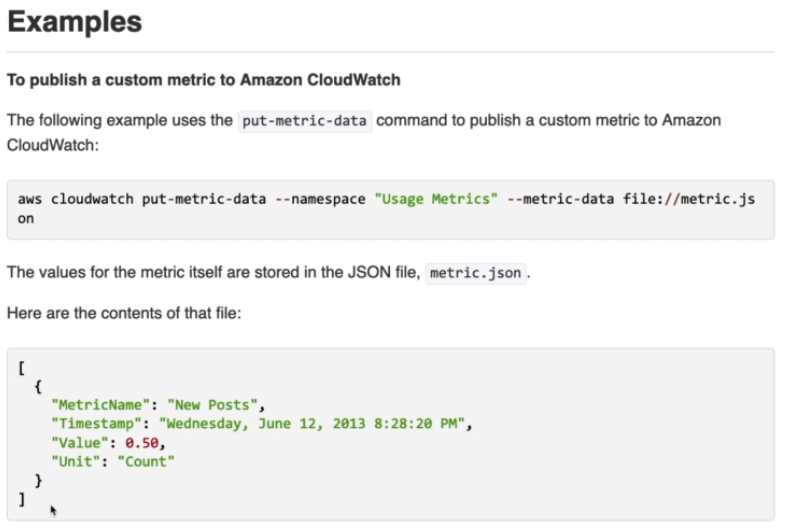
[ CloudWatch Custom Metrics ]
2주 과거, 2시간 미래의 매츠릭 데이터 포인트 사용 가능 (EC2 instance 시간이 정확하게 맞춰져있어야 함)
PutMetricData API 호출을 통해 커스텀 매트릭을 CloudWatch에 보낼 수 있음
- Possibility to define and send your own custom metrics to CloudWatch
- Example : memory(RAM) usage, disk space, number of logged in users
- Use API call PutMetricData
- Ability to use dimensions (attributes) to segment metrics
-- Instance.id
-- Environment.name
- Metric resolution (StorageResolution API parameter - two possible value) :
-- Standard : 1 minute (60 seconds)
-- High Resolution : 1/5/10/30 second(s) - Higher cost
※ Important : Accepts metric data points two weeks in the past and two hours in the future (make usre to configure your EC2 instance time correctly)
[ CloudWatch Dashboards ]
여러개의 AWS Account 및 regions 의 그래프를 대시보드에 사용 가능
- Great way to setup custom dashboards for quick access to key metrics and alarms
- Dashboards are global
- Dashboards can include graphs from different AWS accounts and regions ***
- You can change the time zone & time range of the dashboards
- You can setup automatic refresh (10s, 1m, 2m, 5m, 15m)
- Dashboards can be shared with people who don't have an AWS account (public, email address, 3rd party SSO provider through Amazon Cognito)
- Pricing :
-- 3 dashboards (up to 50 metrics) for free
-- $3 per dashboard per month afterwards
| [AWS] 19-3. AWS Monitoring : CloudWatch Alarms (0) | 2021.09.28 |
|---|---|
| [AWS] 19-2. AWS Monitoring : CloudWatch Logs, Agent (0) | 2021.09.28 |
| [AWS] 18-10. Databases in AWS : ElasticSearch (0) | 2021.09.26 |
| [AWS] 18-9. Databases in AWS : Neptune (0) | 2021.09.26 |
| [AWS] 18-8. Databases in AWS : Glue (0) | 2021.09.26 |
[ Databases in AWS : ElasticSearch ]
주로 다른 DB 를 보완하기위해 사용
필드 상관없이 조회 가능, 부분 매칭이어도 조회가 가능
- Example : In DynamoDB, you can only find by primary key or indexes
- With ElasticSearch, you can search any field, even partially matches
- It's common to use ElasticSearch as a complement to another database
- ElasticSearch also has some usage for Big Data applications
- You can provision a cluster of instances
- Built-in integrations : Amazon Kinesis Data Firehose, AWS IoT, and Amazon CloudWatch Logs for data ingestion
- Security through Cognito & IAM, KMS encryption, SSL & VPC
- Comes with Kibana (visualization) & Logstash (log ingestion) - ELK stack
[ ElasticSearch for Solutions Architect ]
Operations : similar to RDS
Security : Cognito, IAM, VPC, KMS, SSL
Reliability : Multi-AZ, clustering
Performance : based on ElasticSearch project(open source), petabyte scale
Cost : pay per node provisioned (similar to RDS)
Remember : ElasticSearch = Search/Indexing
| [AWS] 19-2. AWS Monitoring : CloudWatch Logs, Agent (0) | 2021.09.28 |
|---|---|
| [AWS] 19. AWS Monitoring : CloudWatch (0) | 2021.09.27 |
| [AWS] 18-9. Databases in AWS : Neptune (0) | 2021.09.26 |
| [AWS] 18-8. Databases in AWS : Glue (0) | 2021.09.26 |
| [AWS] 18-7. Databases in AWS : Redshift (0) | 2021.09.25 |
[ Databases in AWS : Neptune ]
- Fully managed graph database
- When do we use Graphs?
-- High relationship data
-- Social Networking : Users friends with Users, replied to comment on post of user and likes other comments
-- Knowledge graphs
- Highly available across 3 AZ, with up to 15 read replicas
- Point-in-time recovery, continuous backup to Amazon S3
- Support for KMS encryption at rest + HTTPS
[ Neptune for Solutions Architect ]
Operations : similar to SDS
Security : IAM, VPC, KMS, SSL (similar to RDS) + IAM Authentication
Reliability : Multi-AZ, clustering
Performance : best suited for graphs, clustering to improve performance
Cost : pay per node provisioned (similar to RDS)
※ Remember : Neptune = Graphs
| [AWS] 19. AWS Monitoring : CloudWatch (0) | 2021.09.27 |
|---|---|
| [AWS] 18-10. Databases in AWS : ElasticSearch (0) | 2021.09.26 |
| [AWS] 18-8. Databases in AWS : Glue (0) | 2021.09.26 |
| [AWS] 18-7. Databases in AWS : Redshift (0) | 2021.09.25 |
| [AWS] 18-6. Databases in AWS : Athena (0) | 2021.09.25 |
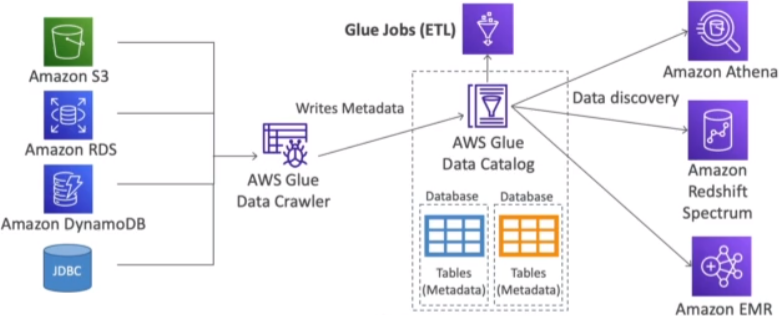
[ Databases in AWS : Glue ]
- Managed extract, transform, and load (ETL) service
- Useful to prepare and transform data for analytics
- Fully serverless service

[ Glue Data Catalog ]
- Glue Data Catalog : catalog of datasets
| [AWS] 18-10. Databases in AWS : ElasticSearch (0) | 2021.09.26 |
|---|---|
| [AWS] 18-9. Databases in AWS : Neptune (0) | 2021.09.26 |
| [AWS] 18-7. Databases in AWS : Redshift (0) | 2021.09.25 |
| [AWS] 18-6. Databases in AWS : Athena (0) | 2021.09.25 |
| [AWS] Databases in AWS : S3 (0) | 2021.09.25 |
[ Databases in AWS : Redshift ]
PostgreSQL 기반이지만 OLTP(트랜잭션 프로세싱) 지원하지않음
로우기반이아닌 칼럼기반 데이터 저장
MPP(대규모 병렬 쿼리)를 사용하여 다른 데이터베이스에 비해 월등히 뛰어난 성능
AWS Quicksight/Tableau 등의 BI(Business Intelligence) 툴 제공
- Redshift is based on PostgreSQL, but it's not used for OLTP(Online Transaction Processing)
- It's OLAP(Online Analytical Processing) - online analytical processing (analytics and data warehousing)
- 10x better performance than other data warehouses, scale to PBs of data
- Columnar storage of data (instead of row based)
- Massively Parallel Query Execution (MPP) -> reason why it is such high performance
- Pay as you go based on the instances provisioned
- Has a SQL interface for performing the queries
- BI(Business Intelligence tools such as AWS Quicksight or Tableau integrate with it
- Data is loaded from S3, DynamoDB, DMS, other DBs
- From 1 node to 128 nodes, upto 128TB of space per node
-- Leader node : for query planning, results aggregation
-- Compute node : for performing the queries, send results to leader
- Redshift Spectrum : perform queries directly against S3 (no deed to load)
- Backup & Restore, Security VPC / IAM / KMS, Monitoring
- Redshift Enhanced VPC Routing : COPY / UNLOAD goes through VPC
[ Redshift - Snapshots & DR ]
- Redshift has no "Multi-AZ" mode
- Snapshots are point-in-time backups of a clust, stored internally in S3
- Snapshots are incremental (only what has changed is saved)
- You can restore a snapshot into a new cluster
-- Automated : every 8 hours, every 5 GB, or on a schedule, Set retention
-- Manual : snapshot is retained until you delete it
- You can figure Amazon Redshift to automatically copy snapshots (automated or manual) of a cluster to another AWS Region
DR(Disaster Recovery) plan : 스냅샷 자동생성 활성화, Redshift cluster 가 자동으로 스냅샷을 다른 AWS Region에 카피하도록 설정

[ Loading data into Redshift ]

[ Redshift Spectrum ]
S3 의 데이터를 Redshift 테이블에 직접 넣지 않고(로딩하지 않고) 쿼리의 실행이 가능하도록 하는 기능
Redshift cluster 가 활성화 되어있어야 사용가능
- Query data that is already in S3 without loading it
- Must have a Redshift cluster available to start the query
- The query is then submitted to thousands of Redshift Spectrum nodes

[ Redshift for Solutions Architect ]
Operations : like RDS
Security : IAM, VPC, KMS, SSL (like RDS)
Reliability : auto healing features, cross-region snapshot copy
Performance : 10x performance vs other data warehousing, compression
Cost : pay per node provisioned, 1/10th of the cost vs other warehouses
vs Athena : faster queries / joins / aggregations thanks to indexes
※ Redshift = Analytics / BI / Data Warehouse
| [AWS] 18-9. Databases in AWS : Neptune (0) | 2021.09.26 |
|---|---|
| [AWS] 18-8. Databases in AWS : Glue (0) | 2021.09.26 |
| [AWS] 18-6. Databases in AWS : Athena (0) | 2021.09.25 |
| [AWS] Databases in AWS : S3 (0) | 2021.09.25 |
| [AWS] 18-5. Databases in AWS : DynamoDB (0) | 2021.09.25 |
[ Athena Overview ]
Database 는 아니지만 S3위에 query 엔진을 제공
- Fully Serverless database with SQL capabilities
- Used to query data in S3
- Pay per query
- Output results back to S3
- Secured through IAM
※ Use Case : one time SQL queries, serverless queries on S3, log analytics
[ Athena for Solutions Architect ]
Operations : no operations needed, serverless
Security : IAM + S3 security
Reliability : managed service, uses Presto engine, highly available
Performance : queries scale based on data size
Cost : pay per query / per TB of data scanned, serverless
| [AWS] 18-8. Databases in AWS : Glue (0) | 2021.09.26 |
|---|---|
| [AWS] 18-7. Databases in AWS : Redshift (0) | 2021.09.25 |
| [AWS] Databases in AWS : S3 (0) | 2021.09.25 |
| [AWS] 18-5. Databases in AWS : DynamoDB (0) | 2021.09.25 |
| [AWS] 18-4. Databases in AWS : ElastiCache (0) | 2021.09.23 |