[Security] SSO 개념 (SAML, OAuth, OIDC) - https://nyyang.tistory.com/m/142


반응형

[ AWS Config ]

AWS 리소스의 변화에 대한 로깅으로 Security group 에 제한된 SSH 접근이 있는지, S3 버킷이 퍼블릭 억세스 인지, ALB(Application Load Balancer) 설정이 어떻게 변했는지 등에 대한 로깅.

region 별 서비스, 변경시 SNS 알림 가능, region/계정에 대한 집계 가능, S3 에 저장하여 Athena를 통한 분석 가능

- Helps with auditing and recording compliance of your AWS resources

- Helps record configurations and changes over time

- Questions that can be solved by AWS Config:

  Is there unrestricted SSH access to my security groups?

  Do my buckets have any public access?

  How has my ALB configuration changed over time?

- You can receive alerts (SNS notifications) for any changes

- AWS Config is a per-region service

- Can be aggregated across regions and accounts

- Possibility of storing the configuration data into S3 (analyzed by Athena)


[ Config Rules ]

사전 정의된 룰 사용가능

각 EBS 디스크가 gp2 타입인지 확인, EC2 instance 가 t2.micro 타입인지 확인하는 등의 사용자 지정 룰 사용 가능(AWS Lambda 사용)

설정 변경시 트리거에의해 동작 혹은 스케쥴링에 의해 확인 가능.

Confg Rules 는 설정변경을 막진 않는다.

무료 아님.

- Can use AWS managed config rules (over 75 rules)

- Can make custom config rules (must be defined in AWS Lambda)

  ex1: evaluate if each EBS disk is of type gp2

  ex2: evaluate if each EC2 instance is t2.micro

- Rules can be evaluated/triggered For each config changes (+ at regular time intervals)

- AWS Config Rules does not prevent actions from happening (no deny)

- Pricing : no free tier, pay per configuration item recorded per region, pay per config rule evaluation per region


[ Config Rules - Remediations ]

SSM 자동화 문서를 사용하여 부적합 리소스에 대한 수정을 자동화

Lambda 함수 호출하는 사용자 지정 문서 생성 가능

자동 수정 후에도 리소스가 부적합한 경우 retry 가능

- Automate remediation of non-compliant resources using SSM Automation Documents

- Use AWS-Managed Automation Documents or create custom Automation Documents

  Tip: you can create custom Automation Documents that invokes Lambda function

- You can set Remediation Retries if the resource is still non-compliant after auto-remediation


[ Config Rules - Notifications ]

- Use EventBridge to trigger notifications when AWS resources are non-compliant

- Ability to send configuration changes and compliance state notifications to SNS (all events - use SNS Filtering or filter at client-side)


[ CloudWatch vs CloudTrail vs Config ]

CloudWatch

- Performance monitoring (metrics, CPU, network, etc..) & dashboards

- Events & Alerting

- Log Aggregation & analysis

CloudTrail

- Record API calls made within your Account by everyone

- Can define trails for specific resources

- Global Service

Config

- Record configuration changes

- Evaluate resources against compliance rules

- Get timeline of changes and compliance


[ For an Elastic Load Balancer ]

CloudWatch :

메트릭에 기반한 성능 모니터링

- Monitoring Incoming connections metric

- Visualize error codes as a % over time

- Make a dashboard to get an idea of your load balancer performance

Config :

설정 정합성 확인

- Track security group rules for the Load Balancer

- Track configuration changes for the Load Balancer

- Ensure an SSL certificate is always assigned to the Load Balancer(compliance)

CloudTrail :

어떤 사용자가 설정을 변경했는지 확인

- Track who made any changes to the Load Balancer with API calls


반응형

'infra & cloud > AWS' 카테고리의 다른 글

[AWS] 20-1. AWS STS, Identity Federation  (0) 2022.05.24
AWS saml  (0) 2022.05.19
[AWS] 19-5. CloudTrail  (0) 2022.05.16
[AWS] 19-4. AWS EventBridge  (0) 2022.05.16
[AWS] 19-3. AWS Monitoring : CloudWatch Alarms  (0) 2021.09.28

[ CloudTrail ]

CloudTrail 은 사용자 이벤트 로깅과 비슷한 기능으로 default 로 활성화 되어있으며 무료임.

콘솔/SDK/CLI/AWS Services 에서의 히스토리를 확인할 수 있음

- Provides governance, comliance and audit for your AWS Account

- CloudTrail is enabled by default

- Get an history of events / API calls made within your AWS Account by : 

  Console/SDK/CLI/AWS Services

- Can put logs from CloudTrail into CloudWatch Logs or S3

- A trail can be applied to All Regions (default) or a single Region

- If a resource is deleted in AWS, ingestigate CloudTrail first.


[ CloudTrail Events ]

관리이벤트와 데이터 이벤트 CloudTrail Insights 이벤트 등으로 나눌 수 있음

보안/라우팅 설정 등의 AWS 계정의 리소스에 대해 수행되는 작업들, S3 object 레벨의 작업, Lambda 함수 실행 기록 등 (데이터 이벤트는 용량문제로 default 가 비활성화 상태임)

1. Management Events :

- Operations that are performed on resources in your AWS account

- Examples :

  Configuring security (IAM AttachRolePolicy)

  Configuring rules for routing data (Amazon EC2 CreateSubnet)

  Setting up logging (AWS CloudTrail CreateTrail)

- By default, trails are configured to log management events

- Can separte Read Events (that don't modify resources) from Write Events (that may modify resources)

2. Data Events :

- By default, data events are not logged (because high volume operations)

- Amazon S3 object-level activity (ex: GetObject, DeleteObject, PutObject) : can seperate Read and Write Events

- AWS Lambda function execution activity (that Invoke API)

3. CloudTrail Insights Events :

CloudTrail Insights 를 활성화하여 계정의 비정상적인 활동 감지

부정확한 자원 할당/서비스 사용량 초과 등

* 일반 관리 이벤트를 분석하여 기준선 생성 후 쓰기 이벤트를 지속적으로 분석하여 비정상적 패턴 감지

- Enable CloudTrail Insights to detect unusual activity in your account

inaccurate resource provisioning

hitting service limits

Bursts of AWS IAM actions

Gaps in periodic maintenance activity

- CloudTrail Insights analyzes normal management events to create a baseline

- And then continuously analyzes write events to detect unusual patterns

Anomalies appear in the CloudTrail console

Event is sent to Amazon S3

An EventBridge event is generated (for automation needs)


[ CloudTrail Events Retention ]

이벤트 로깅은 90일간 CloudTrail에 보관되며, 90일 이상 저장하고 싶으면 S3 에 쌓아야함. S3 쌓을 경우 Athena 를 사용하여 쿼리 할 수 있음

- Events are stored for 90 days CloudTrail

- To keep events beyond this period, log them to S3 and use Athena

반응형

[ Amazon EventBridge ]

CloudWatch 다음에 나온 관제 기능. AWS service 를 기반한 이벤트 버스와 기타 소프트웨어 및 사용자 앱 기반 이벤트 버스 사용 가능. 타 AWS 계정에서 이벤트 버스 접근이 가능. 이벤트 버스로 보내지는 이벤트를 저장관리 할 수 있음.

(관제 알림 및 메시지를 보관 하는 느낌)

- EventBridge is the next evolution of CloudWatch Events

- Default Event Bus - generated by AWS services (CloudWatch Events)

- Partner Event Bus - receive events from SaaS service or applications (Zendesk, DataDog, Segment, Auth0)

- Custom Event Buses - for your own applications

- Event buses can be accessed by other AWS accounts

- You can archive events (all/filter) sent to an event bus (indefinitely or set period)

- Ability to replay archived events

- Rules : how to process the events (liake CloudWatch Events)


[ Amazon EventBridge - Schema Registry ] 

EventBridge 의 Schema registry 를 통해 코드를 생성하여 이벤트 버스에서 데이터가 어떻게 구조화 되어있는지 확인이 가능. 버전 관리 가능. (JSON 형태)

- EventBridge can analyze the events in your bus and infer the schema 

- The Schema Registry allows you to generate code for your application, that will know in advance how data is structured in the event bus

- Schema can be versioned


[ Amazon EventBridge - Resource-based Policy ] 

다른 AWS 계정 또는 AWS region 의 이벤트 버스 허용/거부 가능

- Manage permissions for a specific Event Bus

  Example : allow/deny events from another AWS account or AWS region

- Use case : aggregate all events from your AWS Organization in a single AWS account or AWS region


[ Amazon EventBridge vs CloudWatch Events ] 

CloudWatch 확장형이 Amazon EventBridge(최근엔 CloudWatch 메뉴자체가 없어진듯. Amazon EventBridge 로 명칭자체가 바뀌어서 노출되는 듯)

공통점 : 동일한 이벤트 버스 기능(관제)

차이점 : EventBridge는 Schema Registry 기능이 있으며, 사용자 앱 및 SaaS(소프트웨어) 용 이벤트 버스 사용 가능

- Amazon EventBridge builds upon and extends CloudWatch Events

- It uses the same service API and endpoint, and the same underlying service infrastructure

- EventBridge allows extension to add event buses for your custom applications and your third-party SaaS apps

- EventBridge has the Schema Registry capability

- EventBridge has a different name to mark the new capabilities

- Over time, the CloudWatch Events name will be replaced with EventBridge


반응형

[ AWS Monitoring : CloudWatch Alarms ]

Alarm은 metric 값에 대한 알림을 주기위해 사용

- Alarms are used to trigger notifications for any metric

- Various options (sampling, %, max, min, etc..)

- Alarms States :

  1) OK

  2) INSUFFICIENT_DATA

  3) ALARM

- Period :

  -- Length of time in seconds to evaludate the metric

  -- High resolution custom metrics : 10 sec, 30 sec, or multiples of 60 sec


[ CloudWatch Alarm Targets ]

CloudWatch 가 Alarm 이 울리면(metric 값에 의해) EC2 를 Stop, Terminate, Reboot, or Recover 할 수 있음

Auto Scaling 실행

SNS 로 알림

- Stop, Terminate, Reboot, or Recover an EC2 Instance 

- Trigger Auto Scaling Action

- Send notification to SNS (from which you can do pretty much anything)


[ EC2 Instance Recovery ]

- Status Check :

  Instance status = check the EC2 VM

  System status = check the underlying hardware

Recovery : Same Private, Public, Elastic IP, metadata, placement group


[ CloudWatch Alarm : good to know ]

CloudWatch Logs Metrics Filter 에 의해 알람이 생성되며 알람은 SNS 를 통해 adm에게 알림

- Alarms can be created based on CloudWatch Logs Metrics Filters

- To test alarms and notifications, set the alarm state to Alarm using CLI

aws cloudwatch set-alarm-state --alarm-name "myalarm" --state-value ALARM --state-reason "testing purposes"


[ CloudWatch Events ]

AWS 서비스 관제기능

EC2 인스턴스 기동 등의 AWS 서비스로부터 이벤트 인터셉트. 스케쥴링이나 크론으로 설정 가능

* EC2 인스턴스 실행시 관제 메시지 발생시키거나 하는 등의 기능

Event Pattern : Intercept events from AWS services (Sources)

- Example sources: EC2 Instance Start, CodeBuild Failure, S3, Trusted Advisor

- Can intercept any API call with CloudTrail integration

Schedule or Cron

A JSON payload is created from the event and passed to a target

- Compute : Lambda, Batch, ECS task

- Integration : SQS, SNS, Kinesis Data Streams, Kinesis Data Firehose

- Orchestration : Step Functions, CodePipeline, CloudBuild

- Maintenance : SSM, EC2 Actions


반응형

[ AWS Monitoring : CloudWatch Logs ]

- Applications can send logs to CloudWatch using the SDK

- CloudWatch can collect log from :

  1) Elastic Beanstalk : collection of logs from application

  2) ECS : collection from containers

  3) AWS Lambda : collection from function logs

  4) VPC Flow Logs : VPC specific logs

  5) API Gateway

  6) CloudTrail based on filter

  7) CloudWatch log agents : for example on EC2 machines

  8) Route53 : Log DNS queries

- CloudWatch Logs can go to :

  1) Batch exporter to S3 for archival

  2) Stream to ElasticSearch cluster for further analytics


[ AWS CloudWatch Logs ]

- Logs storage architecture :

  -- Log groups : arbitrary(임의의) name, usually representing an application

  -- Log stream : instances within application/log files/containers

- Can define log expiration policies (never expire, 30 days, etc..)

- Using the AWS CLI we can trail CloudWatch logs

- To send logs to CloudWatch, make sure IAM permissions are correct!

- Security : encryption of logs using KMS at the Group Level


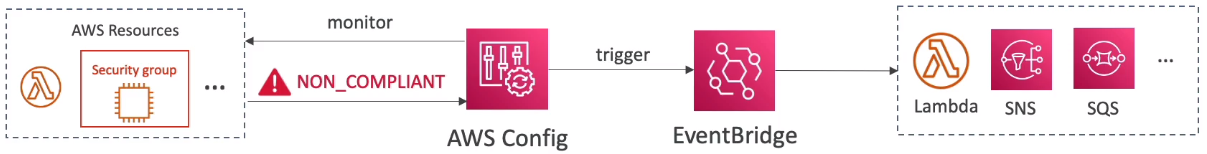
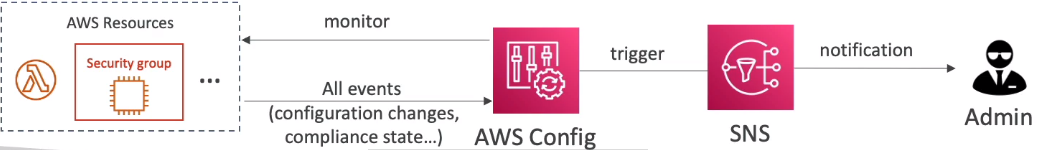
[ CloudWatch Logs Metric Filter & Insights ]

- CloudWatch Logs can use filter expressions

  -- For example, find a specific IP inside of a log

  -- Metric filters can be used to trigger alarms

※ CloudWatch Logs Insights (new - Nov 2018) can be used to query logs and add queries to CloudWatch Dashboards


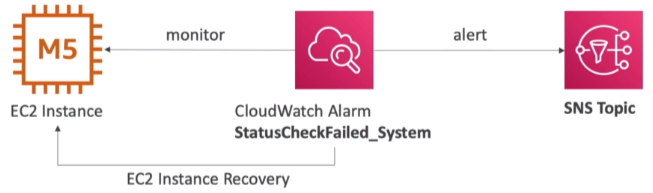
[ CloudWatch Logs for EC2 ]

- By default, no logs from your EC2 machine will go to CloudWatch

- You need to run a CloudWatch agent on EC2 to push the log files you want

- Make sure IAM permissions are correct

- The CloudWatch log agent can be setup on-premises too

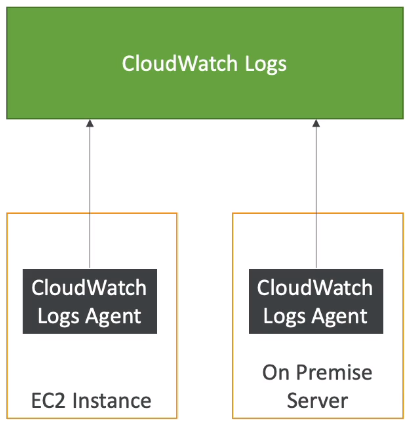
※ On-premise : 자사가 보유한 서버에 서비스 구축

※ Off-premise : AWS와 같은 원격 클라우드 등에 서비스 구축


[ CloudWatch Log Agent & Unified Agent ]

- For virtual servers (EC2 instances, on-premise servers..)

1. CloudWatch Logs Agent

   - Old version of the agent

   - Can only send to CloudWatch Logs

-2. CloudWatch Unified Agent

   - Collect additional system-level metrics such as RAM, processes, etc...

   - Collect logs to send to CloudWatch Logs

   - Centralized configuration using SSM Parameter Store


[ CloudWatch Unified Agent - Metrics ] 

- Collected directly on your Linux server / EC2 instance

1) CPU (active, guest, idle, system, user, steal)

2) Disk metrics (free, used, total), Disk IO (writes, reads, bytes, iops)

3) RAM (free, inactive, used, total, cached)

4) Netstat (number of TCP and UDP connections, net packets, bytes)

5) Processes (total, dead, bloqued, idle, running, sleep)

6) Swap Sapce (free, used, used &)

※ Reminder : out-of-the box metrics for EC2 - disk, CPU, network (high level)


반응형

[ AWS Monitoring : CloudWatch ]

[ CloudWatch Metrics ]

- CloudWatch provides metrics for every services in AWS

- Metric is a variable to monitor (CPUUtilization, NetworkIn..)

- Metrics belong to namespaces

- Demension is an attribute of a metric (instance id, environment, etc...)

- Up to 10 dimensions per metric

- Metrics have timestamps

- Can create CloudWatch dashboards of metrics


[ EC2 Detailed monitoring ] 

- EC2 instance metrics have metrics "every 5 minutes"

- With detailed monitoring (for a cost), you get data "every 1 minute"

- Use detailed monitoring if you want to scale faster for your ASG

- The AWS Free Tier allows us to have 10 detailed monitoring metrics

※ Note : EC2 Memory usage is by default no pushed (must be pushed from inside the instance as a custom metric)


[ CloudWatch Custom Metrics ]

2주 과거, 2시간 미래의 매츠릭 데이터 포인트 사용 가능 (EC2 instance 시간이 정확하게 맞춰져있어야 함)

PutMetricData API 호출을 통해 커스텀 매트릭을 CloudWatch에  보낼 수 있음

- Possibility to define and send your own custom metrics to CloudWatch

- Example : memory(RAM) usage, disk space, number of logged in users

- Use API call PutMetricData

- Ability to use dimensions (attributes) to segment metrics

  -- Instance.id

  -- Environment.name

- Metric resolution (StorageResolution API parameter - two possible value) :

  -- Standard : 1 minute (60 seconds)

  -- High Resolution : 1/5/10/30 second(s) - Higher cost

※ Important : Accepts metric data points two weeks in the past and two hours in the future (make usre to configure your EC2 instance time correctly)


[ CloudWatch Dashboards ]

여러개의 AWS Account 및 regions 의 그래프를 대시보드에 사용 가능

- Great way to setup custom dashboards for quick access to key metrics and alarms

- Dashboards are global

- Dashboards can include graphs from different AWS accounts and regions ***

- You can change the time zone & time range of the dashboards

- You can setup automatic refresh (10s, 1m, 2m, 5m, 15m)

- Dashboards can be shared with people who don't have an AWS account (public, email address, 3rd party SSO provider through Amazon Cognito)


- Pricing :

  --  3 dashboards (up to 50 metrics) for free

  -- $3 per dashboard per month afterwards


반응형

[ Databases in AWS : ElasticSearch ]

주로 다른 DB 를 보완하기위해 사용

필드 상관없이 조회 가능, 부분 매칭이어도 조회가 가능

- Example : In DynamoDB, you can only find by primary key or indexes

- With ElasticSearch, you can search any field, even partially matches

- It's common to use ElasticSearch as a complement to another database

- ElasticSearch also has some usage for Big Data applications

- You can provision a cluster of instances

- Built-in integrations : Amazon Kinesis Data Firehose, AWS IoT, and Amazon CloudWatch Logs for data ingestion

- Security through Cognito & IAM, KMS encryption, SSL & VPC

- Comes with Kibana (visualization) & Logstash (log ingestion) - ELK stack


[ ElasticSearch for Solutions Architect ]

Operations : similar to RDS

Security : Cognito, IAM, VPC, KMS, SSL

Reliability : Multi-AZ, clustering

Performance : based on ElasticSearch project(open source), petabyte scale

Cost : pay per node provisioned (similar to RDS)

Remember : ElasticSearch = Search/Indexing

반응형

[ Databases in AWS : Neptune ]

- Fully managed graph database

- When do we use Graphs?

  -- High relationship data

  -- Social Networking : Users friends with Users, replied to comment on post of user and likes other comments

  -- Knowledge graphs

- Highly available across 3 AZ, with up to 15 read replicas

- Point-in-time recovery, continuous backup to Amazon S3

- Support for KMS encryption at rest + HTTPS


[ Neptune for Solutions Architect ]

Operations : similar to SDS

Security : IAM, VPC, KMS, SSL (similar to RDS) + IAM Authentication

Reliability : Multi-AZ, clustering

Performance : best suited for graphs, clustering to improve performance

Cost : pay per node provisioned (similar to RDS)

※ Remember : Neptune = Graphs

반응형

[ Databases in AWS : Glue ]

- Managed extract, transform, and load (ETL) service

- Useful to prepare and transform data for analytics

- Fully serverless service


[ Glue Data Catalog ]

- Glue Data Catalog : catalog of datasets


반응형

+ Recent posts